M3 becomes a liability for the Fed
"On March 23, 2006, the Board of Governors of the Federal Reserve System will cease publication of the M3 monetary aggregate. The Board will also cease publishing the following components: large-denomination time deposits, repurchase agreements (RPs), and Eurodollars. The Board will continue to publish institutional money market mutual funds as a memorandum item in this release." - Link.
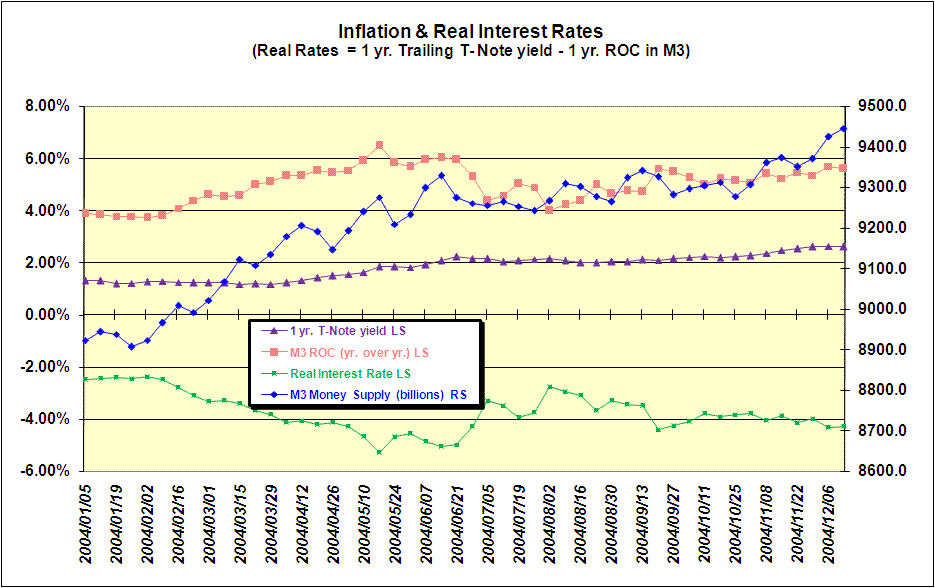
If an increase in the money supply is the cause of a rise in the general price level than M3 is an important measure of price inflation simply because it is considered to be the broadest measure of money and, hence, the best measure of price inflation. With M3 crossing the 10 trillion dollar level the Fed has decided to stop publication of this important data. The Fed by nature is an inflation machine built to support limitless spending by the government. Yet the Fed also enjoys the reputation of being an inflation fighter. In order to protect its image the Fed has found it necessary to cease publication of M3 data. The information provided by M3, coupled with the 1-Year Treasury Constant Maturity Rate, can allow anyone with a spreadsheet to track the rate of inflation and real interest rates. The following chart illustrates this point.

The red line measures, in percentage terms (left scale), the year-over-year rate of change in M3. The purple line represents the yield (left scale) on the 1-Year Constant Maturity Rate. The blue line is M3 itself (right scale in billions of dollars). The green line calculates the real interest rate (left scale) by subtracting the 1-year trailing rate of interest on the 1-Year Constant Maturity Rate from the year-over-year rate of change in M3. As of 10-24-05 the year-over-year rate of change in M3 is 7.6 percent. The 1-year trailing yield of the 1-Year Constant Maturity Rate is 2.27 percent. What this means is that if you lent the US Department of the Treasury your money for 1 year based on the its 1-Year Constant Maturity Rate on 10-24-04 and the Fed increased the money supply during that time by 7.6 percent you have lost 5.33 percent in real terms - real terms being the purchasing power of your hard-earned money. This is what the green line reflects in negative terms. My basic premise is that any increase in the money supply robs someone of the purchasing power of their medium of exchange (money) simply because someone else has produced more of the same medium of exchange without working for it. That is unless you consider running a printing press or pecking the keys of a computer keyboard to create money to be legitimate work.
According to the above chart real rates have been negative for almost 10 years now. One would think that price inflation would have shown up somewhere. Perhaps the stock and housing markets should be checked? One thing really bothers me though and I will share my concern with you. How has the gold price managed (or should I say been managed) not to reflect this massive increase in the money supply? I will have to leave the answer to that question to others.
Goodbye my beloved M3,
Yoshaviah
[Borrowed from GParrishJr@aol.com -- skm]
